
Let’s get started with one of the most basic, and most easily useful, Intarsia reports: the Views Summary.
If you’ve ever had someone you to “just make sure bot filtering is enabled everywhere”, you know the pain of the GA Admin UI limitations. That task, which sounds so simple, will require you to manually go through each property, then each property’s views, clicking and waiting for the view/profile info to load, just to see if a checkbox is checked. No more! Head on over to the Views Summary to have a look:
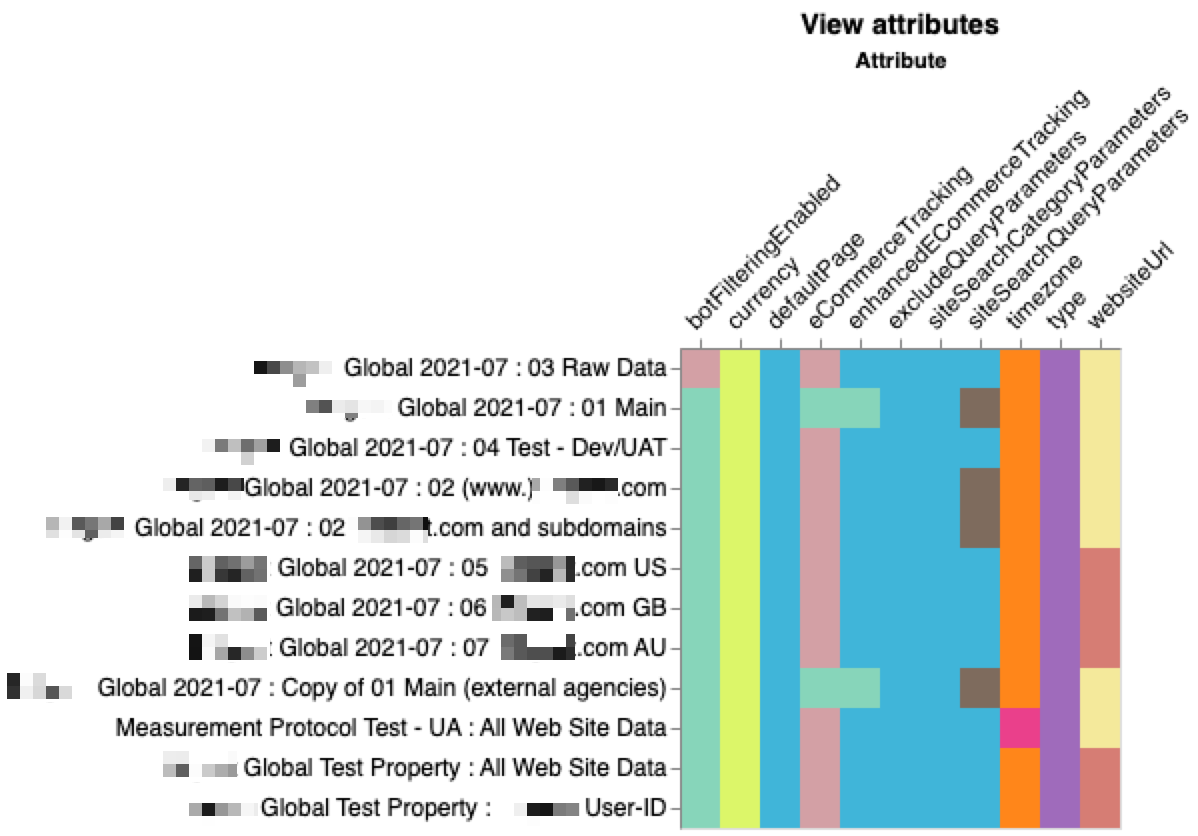
Views are listed down the left, with the format <<Property Name>> : <<View Name>>. View attributes are listed across the top. The color-coding reflects the setting. Of course, from the color-coding you can’t tell what the exact values are; just looking at the graph, though, we can see that the “botFilteringEnabled” setting is different for the first view (“03 Raw Data”) compared to all other views.
To see the exact setting, hover over the square you’re interested in:

‘botFilteringEnabled’ is ‘false’ (off) for 03 Raw Data. You can guess that this means it’s ‘true’ for all other views, or hover over the other squares to see those settings.
This visualization is great for quickly spotting differences in view configurations across an account. For example, we can immediately that the timezone is set differently on the Measurement Protocol Test view, but that the rest of the values match.
Of course, it may be more useful to have this info in a table, and we’ve got you covered there, too:

You’ll see this table format throughout Intarsia. The main thing to immediately know is that these tables are scrollable, both vertically and horizontally. Scroll across to see all of the view attributes, including the ‘Created’ and ‘Last-Updated’ fields (which aren’t in the graph above); scroll down to see more views. You can filter results by typing in the ‘Filter’ box, of course.
Don’t miss out on the three icons in the upper right - use these to:
-
Export to Google Sheets - if you haven’t already authorized this, Intarsia will prompt you to enable authorization for this
-
Export (download) as CSV
-
Copy table data to the clipboard
More report walkthroughs coming soon. Happy analyzing!